Unmatched visibility into your entire infrastructure
All your traffic, clusters, and clouds in one place. Identify performance, security, and capacity issues before they become a problem.
Traffic management at scale is challenging
Organizations deploying hundreds or thousands of load balancers face complex management challenges. Such clusters can process millions of client requests per second.
But where are those requests coming from? How are they impacting system-wide performance? Can those requests be trusted? Many existing solutions complicate the process of monitoring and analyzing real-time operational data.
Usability matters
57% of organizations prioritize ease of use when adopting observability tools.
Observability isn't approachable
39% of observability survey respondents cite complexity and overhead as their biggest observability hurdles.
Monitoring boosts reliability
65% of organizations improved mean time to repair (MTTR) after prioritizing observability.
A centralized control plane with logging, metrics, and dashboards
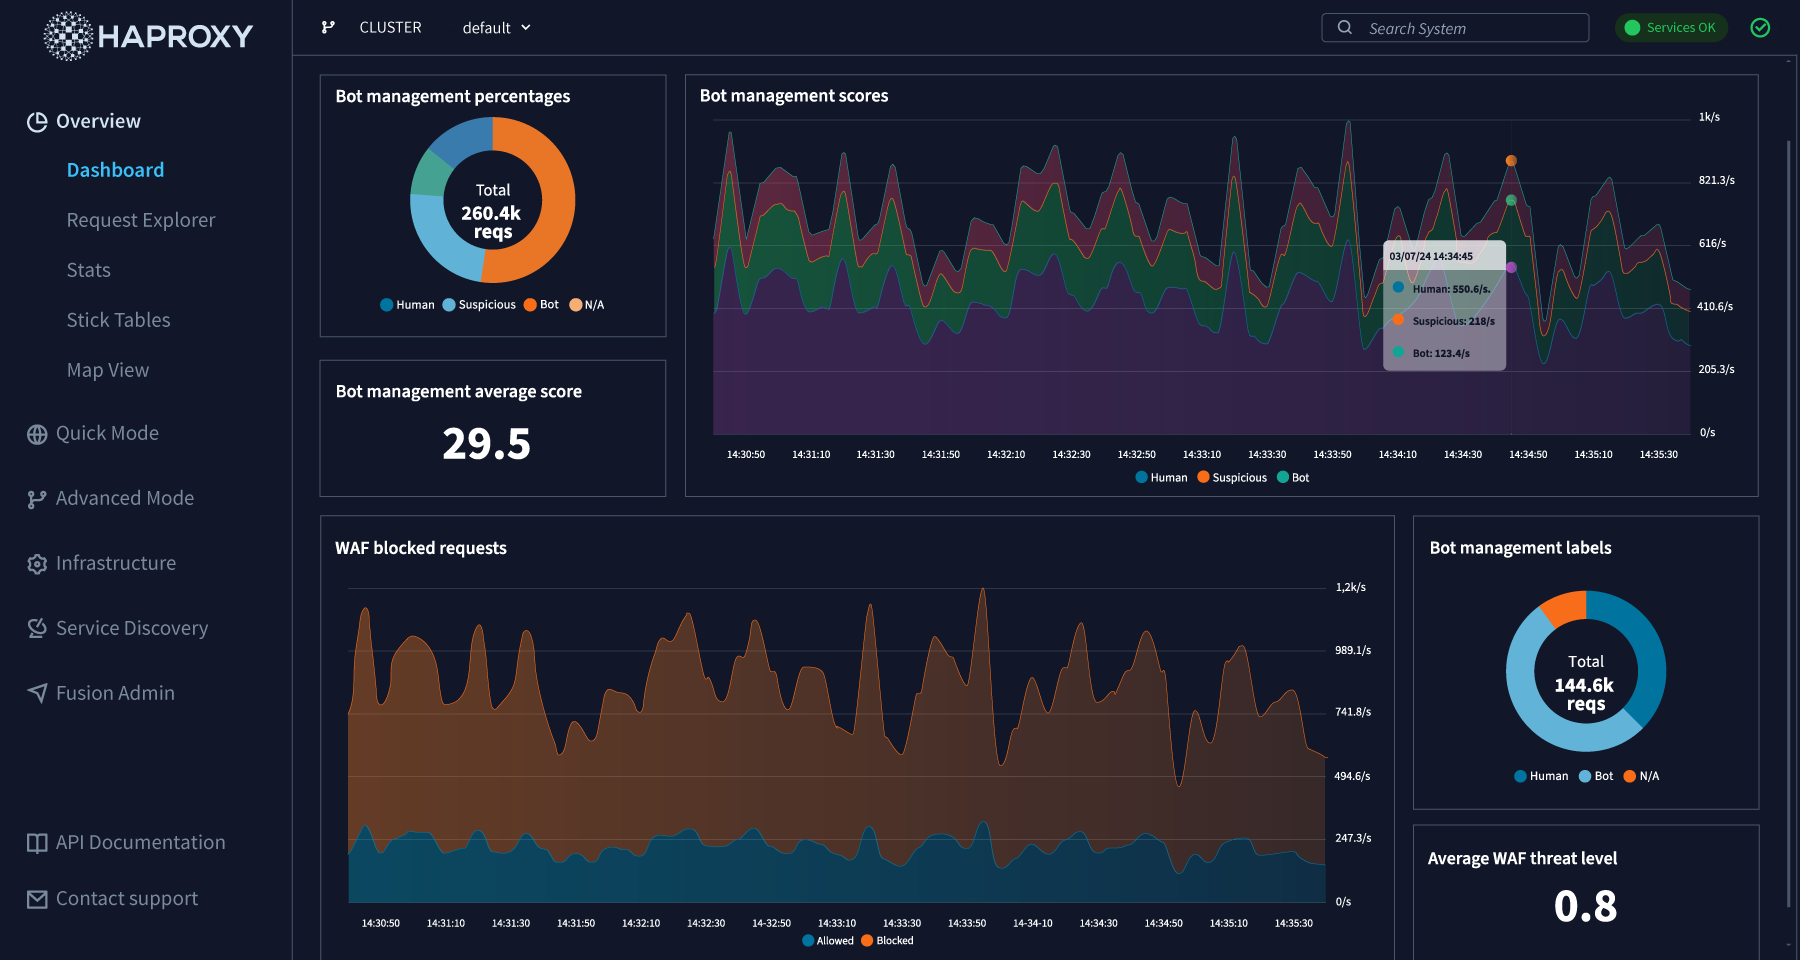
HAProxy Fusion enables full-lifecycle management, monitoring, and automation for all your HAProxy Enterprise clusters. HAProxy Fusion works seamlessly with on-premises deployments, multi-cloud deployments, Kubernetes, and more to make observability simple.
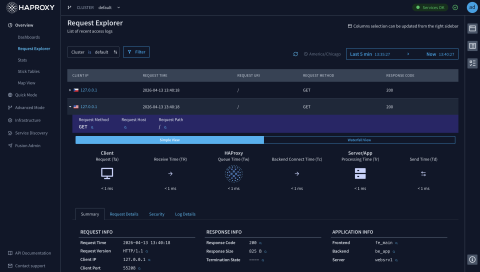
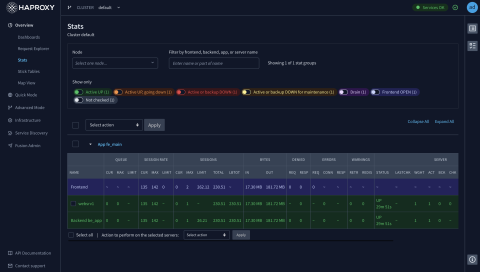
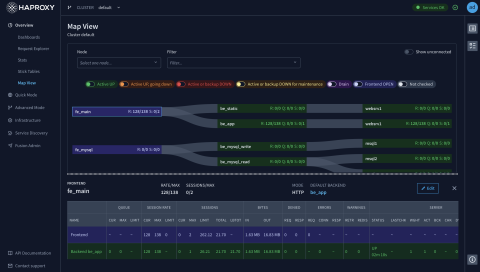
HAProxy Fusion makes it easy to understand changing traffic patterns, security threats, load balancer performance, and server health. A comprehensive observability suite includes customizable dashboards, traffic map views, and a granular Request Explorer — all in one place.

Explore HAProxy observability
Learn how HAProxy Enterprise and HAProxy Fusion can fit into your traffic management strategy.
Gain complete insight into your HAProxy-powered services
Learn how HAProxy Fusion makes it easier to know what's going on with your infrastructure, see where issues reside, and master your application traffic.
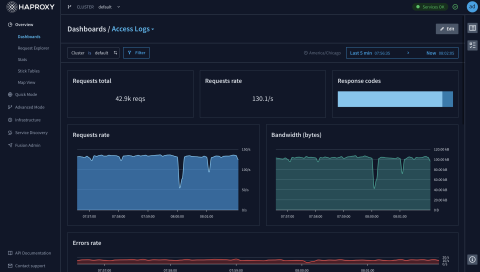
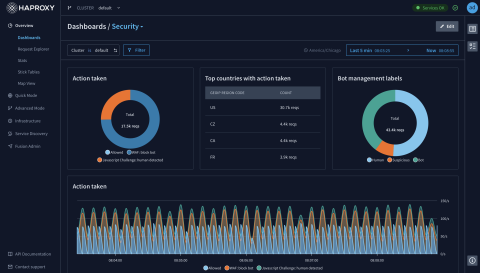
Centralized monitoring and customizable dashboards provide clear visibility into security layers, cluster health, performance metrics, and rich traffic logs.
HAProxy Fusion works seamlessly with HAProxy Enterprise to gather traffic and other operational data in real time — with simple setup and configuration. Quickly install via Ansible module on AWS, Linux, or your chosen VM.
HAProxy Fusion's observability features are accessible via a modern GUI or API — giving you complete control over traffic management without a steep learning curve.
HAProxy Fusion gives you all the tools you need to centrally monitor your HAProxy Enterprise clusters in one place. Troubleshoot faster and ensure smarter resource management, with data at your fingertips.

Do more with HAProxy One
The world's fastest application delivery and security platform seamlessly blends data plane, control plane, and edge network to deliver the world's most demanding applications, APIs, and AI services in any environment.

HAProxy Enterprise
A flexible data plane layer that provides high-performance load balancing, an API/AI gateway, Kubernetes application routing, best-in-class SSL processing, and multi-layered security.
HAProxy Fusion Control Plane
A scalable control plane that provides full-lifecycle management, monitoring, and automation of multi-cluster, multi-cloud, and multi-team HAProxy Enterprise deployments.
HAProxy Edge
A secure edge network that provides a high-capacity global ADN and threat intelligence — enhanced by machine learning — that powers the next-generation security layers in HAProxy Fusion and HAProxy Enterprise.
World-class experience
Award-winning 24/7/365 support from the expert engineers behind HAProxy. We are authoritative on the data plane, control plane, security layers, and the whole networking and Linux stack. We'll do whatever it takes to make your HAProxy deployment a success.
What are users saying about HAProxy observability?
"With HAProxy Fusion Control Plane integrating centralized monitoring with Grafana, we have experienced a substantial increase in observability and easier troubleshooting. HAProxy Enterprise has considerably improved our load balancing infrastructure."
"Putting the servers behind HAProxy also gave us the benefits of HAProxy Fusion, [such as] very improved monitoring. If you've used things like NGINX or Apache or IIS, I think most people can probably agree that all those native logging mechanisms are atrocious — and it's just a pain to grep through text log files and such. So when you're able to visualize them, it just makes it a lot easier to understand what's going on."
Seamless integrations with essential tech