
HAProxy generates over a hundred metrics to give you a nearly real-time view of the state of your load balancers and the services they proxy, but to get the most from this data, you need a way to visualize it.
InfluxData’s InfluxDB suite of applications takes the many discrete data points that make up HAProxy metrics and turns them into time-series data, which is then collected and graphed, giving you insight into the workings of your systems and services.
When you query HAProxy for metrics, you retrieve a singular data point for every metric queried, without history or context. These data points are valuable, but to see how that metric compares over time, you need to gather historical data. InfluxData’s InfluxDB suite of tools extracts these metrics, adds a timestamp, ships them, stores them, aggregates and displays them. Its web-based interface is sophisticated and intuitive and allows for ad-hoc data analysis.
In this article, we’ll walk through all of the steps necessary to get your HAProxy metrics displayed in InfluxDB.
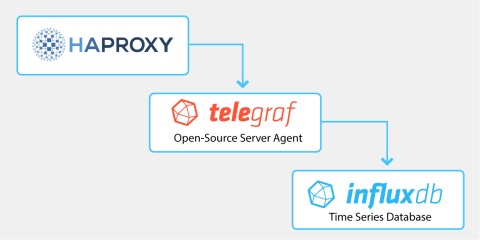
InfluxDB comes in several versions, InfluxDB, InfluxDB Cloud, and InfluxDB Enterprise. In this post, we’ll be using InfluxDB, their open-source offering, but the configuration steps and basic operation are nearly identical to the other products.
To timestamp and ship HAProxy metrics to InfluxDB, we use an InfluxData tool called Telegraf. Telegraf is a server agent with over 200 input plugins written as a standalone Go binary with a minimal memory footprint. The Telegraf HAProxy input plugin connects directly to the HAProxy Runtime API, which you can set up with one line in the HAProxy configuration.
HAProxy configuration
Ensure that you have added the Runtime API in the global section of your HAProxy configuration and reload HAProxy to enable it:
| global | |
| stats socket /run/haproxy/api.sock mode 660 level admin |
Make a note of the /run/haproxy/api.sock location. You will need this when configuring Telegraf.
Our examples use a domain socket, but there are other options outlined in Telegraf’s HAProxy input documentation, such as scraping the HAProxy Stats page.
Visit Get started with InfluxDB 2.0 and install the version for your operating system. After logging in, click the Data menu item on the left and the Buckets tab. Create a bucket called haproxy if it does not exist and set the data retention duration to 30 days.

Click the Tokens tab and generate a new token if there is not one for your user. These tokens handle authentication for communication between Telegraf and InfluxDB. Select the token you generated and then Copy it to Clipboard. Paste this into a text file and keep it handy.
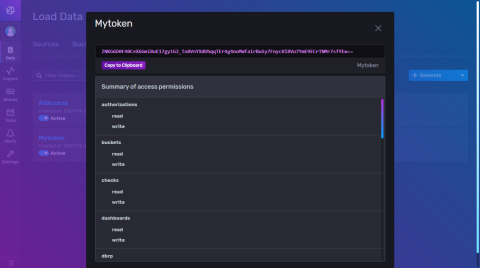
If you prefer to not hardcode this token into the configuration file, you can store it as an environment variable on the server where Telegraf runs:
| $ export INFLUXDB_TOKEN="<Insert InfluxDB token here>" |
To make this variable persistent, add it to the system’s /etc/environment file to have it loaded at boot time.
Install Telegraf
Install Telegraf to the same server where HAProxy is installed.
Open a new, blank config at /etc/telegraf/telegraf.conf in a text editor.
We’ll be collecting several pieces of information from InfluxDB and HAProxy to place in this file.
A Telegraf configuration has two essential components, an output section that points to InfluxDB and an input section that collects metrics from HAProxy’s Runtime API.
Create a new, empty /etc/telegraf/telegraf.conf and add the following:
| [[outputs.influxdb_v2]] | |
| ## The URLs of the InfluxDB cluster nodes. | |
| ## urls exp: http://127.0.0.1:9999 | |
| urls = ["http://127.0.0.1:8086"] | |
| ## Token for authentication. | |
| # token = "$INFLUX_TOKEN" # Uncomment to use environment variable | |
| token = "Your InfluxDB token" # Plain text token | |
| ## Organization is the name of the organization you wish to write to; must exist. | |
| organization = "haproxy" | |
| ## Destination bucket to write into. | |
| bucket = "haproxy" | |
| [[inputs.haproxy]] | |
| servers = ["socket:/run/haproxy/api.sock"] |
Save and close the file.
Although you will normally run Telegraf as a systemd service, you can first run it interactively to test for errors:
| $ sudo systemctl stop telegraf | |
| $ telegraf --config /etc/telegraf/telegraf.conf | |
| 2021-04-23T00:01:17Z I! Starting Telegraf 1.18.1 | |
| 2021-04-23T00:01:17Z I! Loaded inputs: haproxy | |
| 2021-04-23T00:01:17Z I! Loaded aggregators: | |
| 2021-04-23T00:01:17Z I! Loaded processors: | |
| 2021-04-23T00:01:17Z I! Loaded outputs: influxdb_v2 | |
| 2021-04-23T00:01:17Z I! Tags enabled: host=spion | |
| 2021-04-23T00:01:17Z I! [agent] Config: Interval:10s, Quiet:false, Hostname:"my-haproxy", Flush Interval:10s |
Wait 30 seconds or so to check the output for errors. If there are none, InfluxDB is receiving your HAProxy metrics. Stop the interactive command above and start it as a systemd service.
| $ sudo systemctl start telegraf |
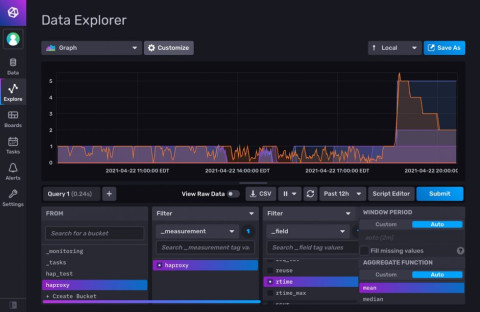
Open your InfluxDB workspace and navigate to the Explore section. Look for the haproxy bucket you created and drill down to find your HAProxy metrics. Select a metric from the Filter column and click Submit. This creates a basic line graph of that metric over the time period you select.
The illustration below shows rtime, the average response time for requests, during a benchmarking test.
Using templates
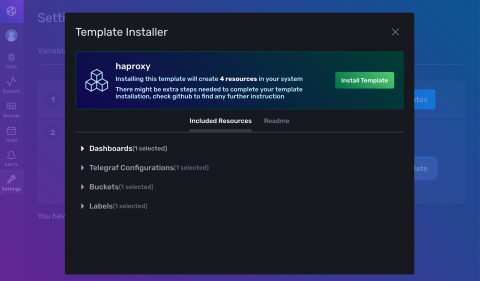
InfluxData has created a comprehensive dashboard template that makes it easy to get up and running. Installation can be done in just a few clicks.
Adding the HAProxy template to InfluxDB
From your InfluxDB workspace, navigate to the Settings tab on the left, click Templates and enter the URL of the resource file for the template:
https://raw.githubusercontent.com/influxdata/community-templates/master/haproxy/haproxy.yml
This will install a dashboard that’s been pre-populated with an array of graphs and charts for an informative view of your metrics:
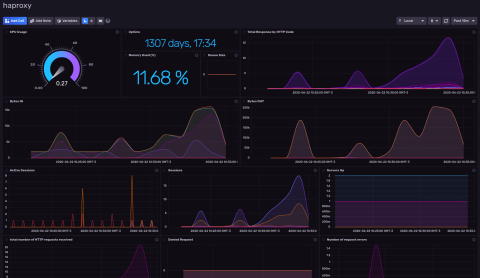
HAProxy Dashboard Template by InfluxData
Conclusion
When you combine HAProxy metrics with InfluxDB, you gain a view of the inner workings of your network as seen by your load balancer. You gain insight into the performance of your application services being load balanced. This lets you conduct data analysis and enables you to respond intelligently to incidents, gauge the efficiency of newly-deployed software and meet your service level objectives.
Interested in seeing more content like this? Subscribe to our blog!
HAProxy Enterprise offers additional ways to increase the observability of your services. Contact us to schedule a demo.
Subscribe to our blog. Get the latest release updates, tutorials, and deep-dives from HAProxy experts.


![Using HAProxy as an API gateway, part 4 [metrics]](https://cdn.haproxy.com/img/containers/partner_integrations/api-gateway-4-metrics.png/bead5c0427ca39dcc7c44ed61225e630/api-gateway-4-metrics.png)