In this presentation, Pierre Souchay tells how the engineers at Criteo built an integration between HAProxy and Consul Connect to operate a fast, secure service mesh that can bridge containers and bare metal servers. Criteo runs thousands of unique services and requires a solution that can outperform the default Consul Connect proxy, Envoy. Their implementation uses several HAProxy features, including the Stream Processing Offload Engine (SPOE), the HAProxy Data Plane API, and dynamic server templates to offload authorization between services, manage mTLS, and health check their applications. The result is a service mesh that is secure, performant, and observable.

Transcript
Good morning ladies and gentlemen. I’m Pierre Souchay, I’m working for the Discovery team at Criteo. I’m also now working for authentication and authorization and security at Criteo. Today, I’m going to talk to you about service mesh and discovery. You might think, why? But simply because whenever you want to deploy some load balancer on a service mesh, you need working discovery in order to make it work at scale.
I’m also the author of consul-templaterb, which is a nice tool to generate configuration based on Consul topology, which is very convenient, for instance, to configure tools such as HAProxy. We’re first going to see a bit of history of Consul at Criteo and we’ll see then how we went to using service mesh at Criteo historically and, finally, we’ll see how we built a service mesh with HAProxy and Consul and listing all the features we implemented already.
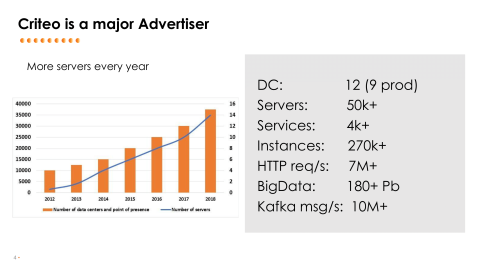
Let’s start with a bit of history of Consul at Criteo. Criteo is basically a very large advertiser with many, many servers, many data centers, many kinds of services, more than 4000 different kinds of services, so, many, many instances of those services. We are dealing with a huge amount of HTTP requests every day on every datacenter. We are also having a quite large Hadoop cluster to crunch all this data coming from the outside and to be able to display stats for people.

So, a very large infrastructure growing every day, but I’d like to go a bit about the architecture we are using for quite a long time at Criteo. Let’s go back a few years ago, in 2013, where this is the kind of architecture we are using for all of our front-facing web applications. We are talking here about lots of those applications, dozens, with many, many instances for each of them. One of the key things to think about is we are using what we call RTB. It stands for Real Time Bidding. It’s basically in the auction system for ads and whenever you go to a newspaper or something like that, we are performing an auction. We are part of an auction and we have to answer very, very quickly to this auction in order for the business to work. Latency was always very, very critical to the business of Criteo.
Basically, a request is coming from the north, from the Internet, through various load balancers. At that time, it was F5 load balancers. It’s going to a web application, here’s more detail on that stuff.

Basically, the top layer of this diagram shows how we configure the load balancers; The load balancer was configured by various Perl shell scripts, huge ones, also by data coming from Chef, which is our configuration management system we use at Criteo to deploy all those machines. For this balancer we did configure some health checks in order to know whether the web application was behaving normally or not.

This was the part coming from the north. Then, we had very specific stuff built in our systems. We basically implemented a service mesh early in 2010 or something like that, where we had a database where we did register all of our microservices so we could directly call them from our application. That’s very important at that time because for one single request coming from the Internet you could generate lots of requests from your web application. You had to talk to caches, to databases and to microservices.
Just adding a load balancer at that point in our system would add both latency, because, of course, you’ve got one hop more to go to the microservice, and also at that time would cost a lot, meaning hundreds of load balancers just to send that out to a microservice. Since we had very, very…an architecture relying heavily on microservices, this would cost quite a lot. So, we did some nice libraries in both C# and JVM languages in order to talk to the systems.

Finally, we had some logs, which are very important for our business that were configured by Chef and so on. That was the three ways of sending data to all the applications just for a single application. The pattern was used everywhere at Criteo.

In 2015 we started adding containers. Why containers? Not only because it’s cool and the developers wanted it, but also from a business point of view it’s very useful to be able to avoid having typed machines, meaning that on a given hardware you can run any kind of application. So, we added containers running Mesos at that time in a similar way as Tobias explained what they did at Yammer. Basically, we added containers and a single machine could run several web applications, several microservices, and so on and so on.
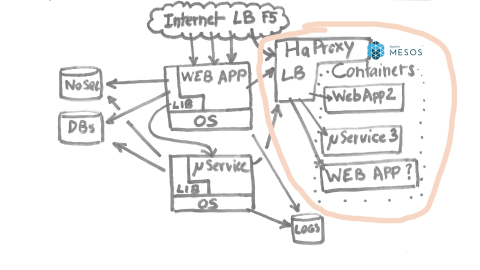
The question here is in order to react quickly to the changes of containers, because when you provision a new machine you spent a few hours waiting for the machine to come up, to be configured properly and so on. It means that it changed from waiting a few minutes to get a machine being up to a few seconds. It’s very different because all of our libraries, our client-side, load balancing libraries we implemented, were relying on the database. We had a polling time, for instance, of ten minutes. So, of course it doesn’t work with containers.
So what we did first was doing exactly the same thing as Yammer, meaning we added HAProxy load balancers that were getting information from Mesos and Marathonon, and generating a configuration.

Everything is fine, we are adding an extra hop, but things are a bit more complicated than that because from our application’s point of view, yes, we can say HAProxy is now the intermediary step to reach our applications, but it gives you many, many problems because beyond your HAProxy you might have ten, hundreds of instances, and for the other instances of your exact same service, but on bare metal, you don’t want to dispatch this traffic blindly. We had to implement…Are we really sure about how do we spread our loads across all services?
The thing is whenever you have thousands of machines you cannot just dump the legacy and say it’s over because just moving from bare metal machines to containers takes a huge amount of time amongst your developers. We were also running Windows systems and, of course, moving to containers running on Linux is not something you can do in a one-minute step.

So, that’s where our system or existing systems that were behaving quite nice, but they were showing their limits: Provisioning time of all of our systems was globally an issue; We had different ways of provisioning our F5 load balancer on the top as the service library; We had newcomers such as Mesos and containers that were showing limits of the database polling mechanism to perform client-side load balancing; Of course, we had issues whenever we wanted to move partially a system to containers while keeping the other on bare metal.
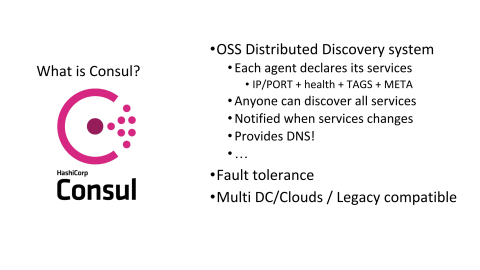
At the time, another big issue we had, basically, was all of those health checks were different in all of our systems and sometimes they would not get along. We really needed something else to move forward. So, introducing Consul. Basically, Consul is a distributed, key-value store, such as etcd or ZooKeeper, but it has also some very strong opinions about what is a service. It already defines a structure, which is a service and this service does not need to run on a specific SDN, software defined network, meaning that you can mix containers, bare metal machines, cloud, and everything should work. It’s basically a middleware to expose and declare your systems.
It also involves something very interesting, which is the ability to define health checks in a centralized way. When you are deploying Consul, you are basically deploying a Consul cluster, which is a group of servers in the same way as you could do it for ZooKeeper, for instance, but you’re also deploying some agents and those agents are running on every machine at Criteo. Those agents are also responsible for checking whether the services they are hosting are working properly and dispatching this information across your cluster.
That’s very interesting because whenever you are reaching some scalability limits, each of your health checks has to be done by each system. Here you have a global view of what is the healthiness of a given system? It’s very important for us. It also provides some very interesting features such as being notified on any service of the platform whenever something changes, meaning that the database polling issue we had, saying, “Do I need to poll every 10 minutes or every one minute or whatever?” disappears. You can be notified whenever the service you’re targeting is changing. That’s very interesting as well.
Of course, in the same way as etcd and ZooKeeper, it has fault tolerance built in, meaning that it’s a good candidate for using it on very large infrastructures.

The step we took was basically registering all of our systems within Consul. We had data from Hadoop, we had systems deployed by Hadoop, by Chef, by a tool we made by ourself, Criteo Deployer, by Mesos. Basically, we registered all those services, so now we are talking about something like 270,000 different instances of services, which is roughly 4000 different kinds of services.
At the same time we added health checks. Basically, every service was responsible for saying, “Oh, I’m okay or I’m not okay.” We added lots of various information that was really useful for what has been described by my colleagues Pierre and William yesterday, for instance, to provision load balancers automatically.

Step 2 was to port all of our client-side libraries to perform this load balancing. We had libraries to perform HTTP load balancing, client-side load balancing, we had Kafka libraries, database access, Memcached, and so on and so on. It took quite a lot of time as well. Instead of using the data published in some database with freshness not very up to date all the time, instead we use Consul to get the notification in real time about what is the service I’m targeting and how does it change, including its healthiness.

Finally, William and Pierre on their team did implement a load balancer relying on Consul, meaning that now instead of having separate systems, Consul is now a big middleware to guess the state of all the services within Criteo. That’s very useful because it means that you can easily replace either by client-side load balancing or by a classical load balancer your system and get the same view. It was not the case before and it led to many many, incidents in the past.

When we did this it took us roughly 1 ½ years or something like that. It was really painful. We had to put lots of optimization into Consul to make it work reliably, but basically we had a full view of everything that was going on in our systems. Everything was running on top of Consul, meaning Consul was distributing this information about healthiness of all of our services across the whole organization. It was really good and we really enjoyed this moment.
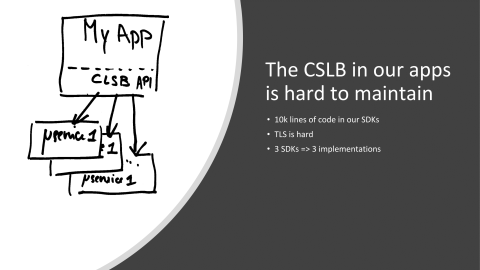
The thing is, still, we have a bit of issues, especially regarding our client-side load balancing libraries. It’s basically small pieces of code running in our applications, but it’s very, very sensitive applications. If you’ve heard about Keep-Alive and stuff like that, you know that just load balancing HTTP data is not a trivial task, especially when you want to do it with millions of requests per second. It means that all the code that we have written for C# or JVM was very sensitive to changes. Whenever you were changing a single command you were…all codebase. It was very risky, actually. It is very risky. We have to be very, very careful about the changes we are applying. Furthermore, we did implement it for performance, meaning that for instance adding TLS or this kind of stuff is almost impossible.
Finally, we are using, for now, two main languages at Criteo, but people say, “I’d like to use Golang. I’d like to use REST, I’d like to use Python, Ruby”, and so on and so on. Of course, this doesn’t scale up, meaning that we don’t want to port those libraries to every language, so having another way to do this with performance in mind would be quite helpful.

One and a half years ago, HashiCorp, the builders of Consul, did introduce Consul Connect. Basically, what is Consul Connect? It’s the famous, fashionable service mesh infrastructure system. It’s basically creating sidecar applications that will, under the old connectivity of your service, that will introduce TLS, that will introduce service discovery and so on. Basically, how it works is you’ve got MyApp1 and instead of adding this complex piece of code, client-side load balancing, you are just talking to localhost and this localhost will forward your requests to the various services you are targeting. That’s the kind of view you have and, of course, Consul is driving all of this because it has a clear view of the whole topology of the whole infrastructure.
Furthermore, it adds some benefits for us, which is, for instance, handling TLS for free with a rotation and so on and so on. It also had some authorization mechanism. That’s quite interesting because in current architecture, even if relying on microservices, it’s sometimes very, very hard to know what is the impact of a system being faulty. I mean that a microservice can be called by another microservice that can be called by a real app. Knowing that whenever your microservice is not working anymore, what are the possible impacts of this? It’s very, very challenging stuff in modern architectures: being able to decide what will come up after one service is down. Having a way to authorize systems will allow you to create a graph, a graph calling instances. Of course, lots of people are using it. They are using Zipkin or tools from the Finagle family or whatever. Basically, it’s very, very hard to have this and to be sure that you didn’t forget anything in your infrastructure.
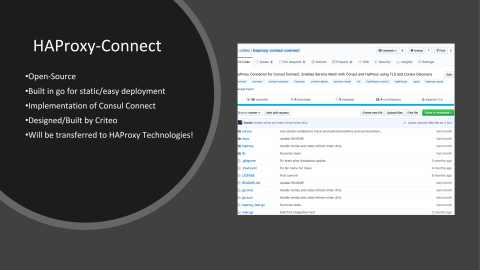
I’m now introducing HAProxy Connect. HAProxy Connect is what? It’s an implementation, an open-source implementation of Consul Connect with HAProxy. Basically, the reference implementation of Consul Connect is using Envoy, but we had a few issues with Envoy, deploying it on all systems, for instance, but also having the ability to talk directly to people from HAProxy Technologies is a big advantage for us. Furthermore, our network engineers are very familiar with HAProxy, less so with Envoy.

We decided to implement it by ourselves and then to transfer it to HAProxy Technologies. This tool is going to be responsible for creating the HAProxy configuration, listing all the changes in the Consul topology, adding TLS for free between all your nodes, and is going to be compatibility, of course, with both bare metal as well as any container system, meaning Kubernetes, Mesos or whatever you want, and cloud, of course. The idea behind it, as well, is to keep it simple. Consul Connect is a service mesh system, but designed to be understandable by normal users, meaning that it doesn’t come with a full load of features. It just does a few things right.
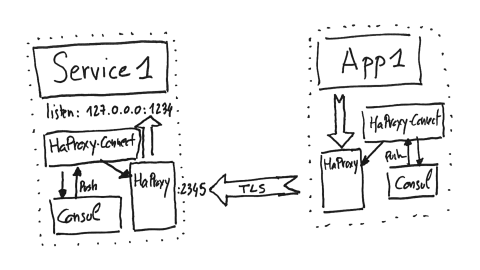
Here is how it will really work. Basically, we are getting the same schema as the first one, which is Application 1 wants to talk to Service 1. So, basically we are creating an HAProxy Connect sidecar system and this HAProxy Connect system is going to create a configuration file for HAProxy and send the commands to HAProxy to be updated whenever those targets, here of Service 1, will be updated, and encapsulating all of this within TLS. On the Service 1 side, HAProxy will be responsible for getting in its frontend the incoming TLS traffic and sending to plaintext to Service 1 itself.

It gives you the ability to get mutual TLS because Consul will be responsible for sending client and server certificates on theTLS side, meaning that both server and client can authenticate themselves and be sure who is calling it. The client validates the server it is talking to and the server knows the caller well. Consul also includes the ability to rotate the certificate and does it periodically, meaning that those secrets are not fixed in time, which is very important as well. For those using HashiCorp’s Vault, it also supports delegating this secrets handling to HashiCorp Vault as well.

What kind of configuration are we doing here into HAProxy to make it work? This is exactly what happens in the system. Basically, on the Service 1 side, so the target, we are creating a frontend directive in HAProxy. This frontend directive will send the data to backends and these backends will have only a single target, which is localhost on a given port. So, basically, the ports, the actual implementation of Service 1; all of this in plaintext.

For those who really want to know, that’s the kind of configuration it’s going to generate.

On the application side, so the client, there’s a frontend in order to receive data from Application 1. In the backend side there will be all the instances of the Service 1 we want to target, meaning that this part is very dynamic. It’s going to change every second. In our systems, for instance, we’ve got services where we’ve got more than 2000 different instances, meaning that those things do change all the time. HAProxy Connect will be responsible for updating this information live, reaching the correct targets every time.

This is the kind of configuration it will generate into HAProxy itself, but it’s not over because, of course, your Service 1 can also be a client of other services.

Your microservice can use other microservices, databases, and so on. It means that, of course, by injecting your topology within Consul you can say, “Yes, I am a server so I’m going to answer to requests, but I also want to target those services.” In that case, everything is kept within the same HAProxy instance and we will generate additional frontends for what we call upstreams in the Consul language, meaning HTTP localhost targets to send requests to Service 2 or Service 3, and so on. All of this will run within the same HAProxy program.

Now, what about authorization? Authorization is done in Consul Connect with the term intentions. Intentions is basically a way to say Service 1 might be called by MyApp, but I don’t want MyOtherApp to call service 1. It’s a very important piece within Consul Connect and it really allows you on the long term to create a graph of your whole infrastructure. That’s where it becomes interesting. As I told you, there is a mutual authentication with TLS, meaning that you are sure that MyOtherApp, because it shows to the target its certificate, Service 1 can be sure that the application which is calling him is the real one because a certificate has been given.

In order to do that, what we did was implement an SPOE mechanism. HAProxy Connect is going to listen for SPOE requests, validate it, and allow the request to pass to the service itself.

So, what is SPOE? SPOE is a way of offloading some work to another agent called SPOA and to perform some kind of validation or stuff like that. In HAProxy it can be used for authenticating, I think, for scanning requests from the Internet, and so on. What we are basically doing is we are configuring HAProxy to use SPOE using HAProxy Connect itself as an SPOA, meaning agent. So, it’s basically receiving requests from HAProxy to validate whether the incoming request is authorized or not.
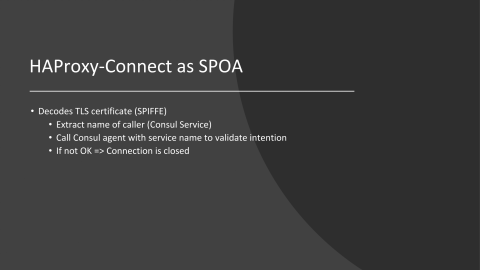
In order to do that, what it does is it decodes the certificate from the client, extracts the name of the caller, performs a call to Consul to validate that the intention has been properly set for this service, and if it’s not okay it’s basically closing the connection.

A bit of under the hood of how this whole stuff is working: HAProxy Connect basically generates an initial HAProxy configuration, a basic configuration with an SPOE configuration, the control socket, and so on.Then it starts HAProxy, then it starts the Data Plane API. Yesterday, Marko talked to you about the Data Plane API. We are using it in order to control HAProxy. The Data Plane API is, just basically, just to remember, a REST API to control HAProxy without the need for creating a configuration file, handling reload, and so on. It removes all the complexity of talking with socat and friends to send commands to HAProxy.

Here are a few of the optimizations we put in these systems. First, of course, we are over allocating the slots of servers, meaning that Consul is sending us lots of updates, sometimes several per second. We don’t want in HAProxy whenever you are changing the number of slots for backends, you need to reload HAProxy. Of course, we want to avoid that as much as possible. So, we over allocate the slots of backends to a power of two. So, we can just enable and disable the servers without reloading HAProxy.
We also apply a convergence mechanism, which is in order to be sure that HAProxy really understands what we mean we simply send all of our commands to the Data Plane API, compare it to the results we expect, and if it’s not working we reload it. It gives us the ability to be sure that HAProxy has the exact state we want to be applied. Whenever something is changing in HAProxy we are sure that even if something is changing on the wire, everything is going to work as expected.

What we did as well is this system, of course, exposes stats. You can expose the HAProxy Stats page as usual, but we also made an exporter compatible with Prometheus that exposes all the metrics from HAProxy Connect including all the requests for egress and ingress.

So, here’s a small capture of one of our systems for egress: Application 1 sending requests to Service 1. It shows, of course, the number of requests per second, the in and out traffic, and the response code with statistics for everybody.

On the other side, on Service 1, you’ve got per ingress service, the details of the statistics, the response code, and so on, the incoming requests per second and so on. Anyway, you can create very easily those dashboards with all the Prometheus statistics or, if you prefer, you might choose, as well, the HAProxy Stats page. Here you already have some kind of meaningful metrics.

On the logs side we also capture the output of HAProxy and redirect it. So, you can redirect it to Syslog or Systemd or whatever your favorite log system. We are doing this and then sending it to Kibana, in our case.

So, we are testing this new piece of software for something like two months in our pre-production and we are using it already in production at Criteo for something like one month. It’s working quite well. On the performance, I had no time unfortunately to do some benchmarks, but basically, it performs better than Envoy with Consul Connect, which is already quite nice. We have around a 20% improvement both in CPU time and throughput. However, it has some kind of extra latency compared to plain HTTP, as we did it in our client-side library stuff.
Everything is open source. In order to deploy it, in order to create it, we also had to create an SPOE library for Go because everything is written in Go. Of course, all of this is open source and we are now talking with HAProxy for them to maintain, HAProxy Technologies, to maintain those projects on the long term. Thank you to Aestek, which is the main developer of the system. Of course, we will be glad for any people wishing to use this kind of service mesh technologies to contribute to the project. Thank you very much!