Integrations
InfluxDB
InfluxDB is a time-series database into which you can store your load balancer metrics. You can then graph the data to see trends over time.
In this guide, we use Telegraf, a metrics-collections tool from InfluxData, to pull metrics from the load balancer and push them to InfluxDB.
Installation and setup Jump to heading
-
Follow the InfluxDB Getting Started guide to install InfluxDB onto a server.
-
Once installed, InfluxDB hosts a UI dashboard at port 8086. Go to the InfluxDB UI at
http://[INFLUXDB SERVER]:8086and click Get Started to set up your initial user account. During setup, you will set the organization and default bucket for your data. -
Go to Data > Buckets and create a new bucket named
haproxy-enterprise.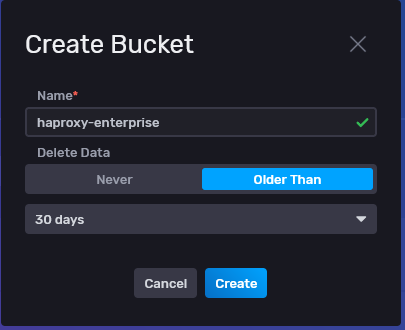
-
Go to Data > Tokens and click Generate to create a new Read/Write token. Set the Read and Write scopes to your
haproxy-enterprisebucket. Telegraf will use this token when connecting to InfluxDB.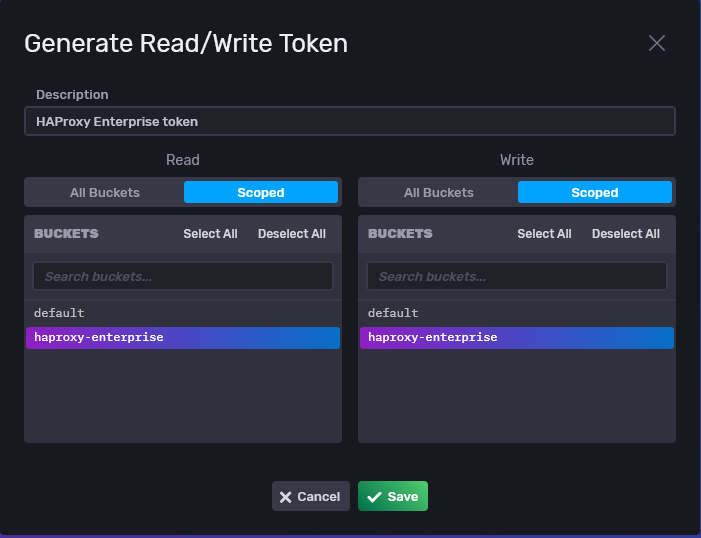
-
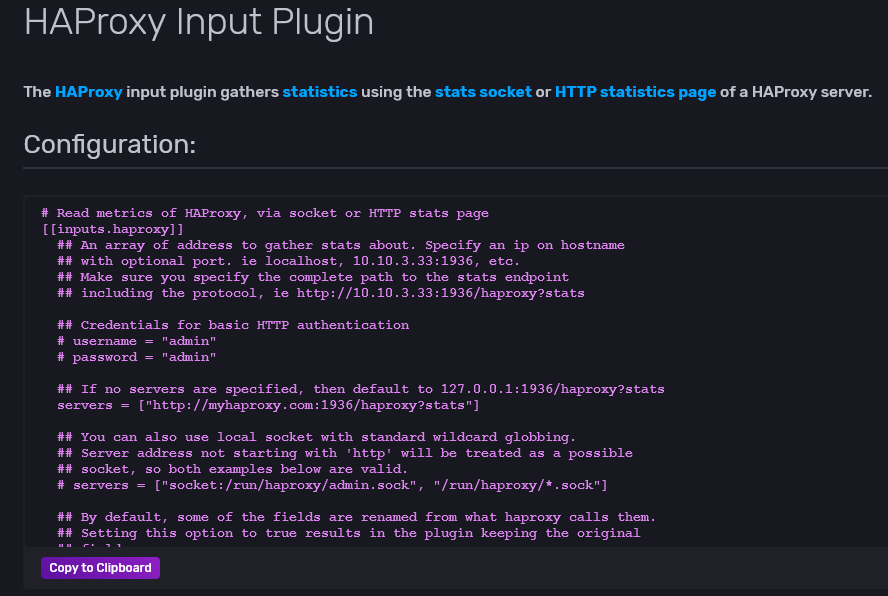
To see an example configuration for Telegraf, go to Data > Sources, find HAProxy in the list of Telgraf plugins, and click it.
Copy the sample configuration from the HAProxy Input Plugin page.
-
Follow the Introducing Telegraf guide to download and install Telegraf onto each of your load balancer servers. Telegraf is the service that exports metrics to InfluxDB.
-
Enable the Runtime API in your load balancer configuration to allow Telegraf to collect metrics. Configure it to listen on the UNIX socket
/var/run/hapee-2.8/hapee-lb.sock:haproxyglobalstats socket /var/run/hapee-2.8/hapee-lb.sock user hapee-lb group hapee mode 660 level admin expose-fd listenershaproxyglobalstats socket /var/run/hapee-2.8/hapee-lb.sock user hapee-lb group hapee mode 660 level admin expose-fd listeners -
Add the
telegrafuser to thehapeegroup so that it has access to the Runtime API socket:nixsudo usermod -a -G hapee telegrafnixsudo usermod -a -G hapee telegraf -
Edit the file
/etc/telegraf/telegraf.conf:-
Uncomment the
[[outputs.influxdb_v2]]section and set the following fields:- set
urlsto the address of your InfluxDB server, which listens on port 8086 - set
tokento the value of the Read/Write token you created in InfluxDB - set
organizationto the organization you set when you installed InfluxDB - set
bucketto haproxy-enterprise
ini[[outputs.influxdb_v2]]urls = [http://192.168.50.26:8086]token = "IyjPRrnA5Fb4P_bHd8YBeea5K-y2DmSV_7D0wT5592YDc9v87vzQKKt-etS2YTHwbpo_gSrFQDhtBUfcDuIzXQ=="organization = "test"bucket = "haproxy-enterprise"ini[[outputs.influxdb_v2]]urls = [http://192.168.50.26:8086]token = "IyjPRrnA5Fb4P_bHd8YBeea5K-y2DmSV_7D0wT5592YDc9v87vzQKKt-etS2YTHwbpo_gSrFQDhtBUfcDuIzXQ=="organization = "test"bucket = "haproxy-enterprise" - set
-
Uncomment the
[[inputs.haproxy]]section. Set theserversfield to the path of the Runtime API socket.ini# Read metrics of HAProxy, via socket or HTTP stats page[[inputs.haproxy]]servers = ["/var/run/hapee-2.8/hapee-lb.sock"]ini# Read metrics of HAProxy, via socket or HTTP stats page[[inputs.haproxy]]servers = ["/var/run/hapee-2.8/hapee-lb.sock"]
-
-
Restart the Telegraf and load balancer services:
nixsudo systemctl restart telegrafsudo systemctl restart hapee-2.8-lbnixsudo systemctl restart telegrafsudo systemctl restart hapee-2.8-lb
Visualize metrics Jump to heading
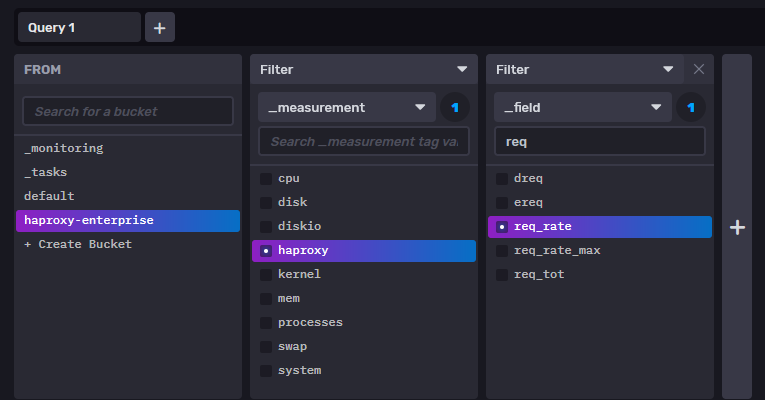
You can create graphs for your load balancer metrics in the InfluxDB UI. Go to Explore and create a new query.
For example, you could create the following query:
- Set FROM to
haproxy-enterprise - Set the first Filter to
_measurementand selecthaproxy - Set the second Filter to
_fieldand selectreq_rateto see the HTTP request rate
HAProxy Monitoring Template Jump to heading
InfluxData also provides an HAProxy monitoring template that configures a prebaked dashboard of commonly used graphs.
-
In the InfluxDB UI, go to Settings > Templates and enter the URL
https://raw.githubusercontent.com/influxdata/community-templates/master/haproxy/haproxy.yml. Then click Install Template. -
The template creates a bucket named
haproxy. Generate a new Read/Write token that has access to that bucket. -
Update the Telegraf configuration on your load balancer servers to use the new token and
haproxyfor the bucket value. -
In the InfluxDB UI, go to Boards and click the haproxy dashboard to see the graphs.
Do you have any suggestions on how we can improve the content of this page?